Printer Operation Status screen
Navigation: Epson Cloud Solution PORT home screen > GO TO DASHBOARD > Printer Operation Status.
Displays the following information for each registered printer:
-
Current operating rate of all monitored printers and the number of printable units
-
Total hourly print volume for all printers on the previous day and the current day
-
All printer operation rates on that day and the total print volume
-
Individual printer operation rate, error/warning information, and print volume
Some printers cannot record print history. Therefore, the areas related to the printer's print history, such as operating results, graphs, and reports, may not be displayed. In addition, the values may not be reflected in the operating results and reports of all printers.

|
Item |
Description |
||
|---|---|---|---|
|
A |
Breadcrumbs |
Displays the path from the Portal Dashboard Home screen to the displayed screen. |
|
|
B |
Title |
Displays the screen title. |
|
|
C |
Groups |
Select the group of printers you want to display. |
|
|
D |
Unit |
Select the unit you want to display, such as graphs and statistical data. |
|
|
E |
Time display |
Displays the current time. |
|
|
F |
Total Printers |
Click the title line to show or hide Total Printers. |
|
|
Operation Status |
The current operating rate for all printers and the number of available printers. |
||
|
G |
Total Print Area |
Displays the total hourly print volume for all printers on the previous day and the current day. |
|
|
H |
Operation Results |
Displays the operating rate for all printers and the total print volume. |
|
|
I |
Status |
Displays individual printer operation rates, print volume, and error/warning information for each printer. |
|
The information displayed is updated at the following time intervals:
-
Every 15 seconds: F. Operation Status, I. Status
-
Every 5 minutes: G. Total Print Area, H. Operation Results
-
Information is updated starting from the time Production Monitor starts.
-
When running Production Monitor in multiple windows, different values may be displayed depending on the difference in the update timing of each window.
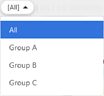
You can filter the displayed printers by groups. Click this setting and select the group you want to display from the drop-down menu. Select [All] to display all printers.
You can click
 > Configuration Manager > Printer List to set up groups.

You can select the unit you want to display in the graph. Click this setting and select the unit you want to display from the drop-down menu.
-
Number of Jobs: Set the number of print jobs sent from the printer as the unit.
-
m: Set the length (m) of the paper used in the print job as the unit.
-
m²: Set the area (m²) of paper used in the print job as the unit.
-
ft: Set the length (ft) of the paper used in the print job as the unit.
-
ft²: Set the area (ft²) of paper used in the print job as the unit.
-
Sheets: Set the number (Sheets) of the paper used in the print job as the unit.
-
imp.: View the actual print job.
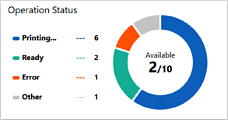
The operating status for monitored printers is displayed in a donut chart.
-
Printing: Printing or canceling a print job.
-
Ready: Waiting to print (includes printers in sleep mode).
-
Error: A normal error such as running out of ink or paper, or a fatal error has occurred.
-
Other: Other statuses, such as under maintenance.
Available: The number of printers that are available for printing is displayed with the total number of monitored printers as the denominator.
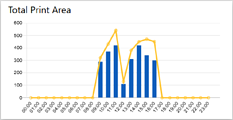
You can check the print volume for all printers on the previous day and for the current day by the hour.
-
Bar graph: Displays the print volume printed for that day.
-
Line chart: Displays the print volume printed for the previous day.
The vertical and horizontal axes have the following meanings:
-
Vertical axis: The unit you set in Unit.
-
Horizontal axis: 1 hour. The left edge is 0 and the right edge is 23.
Hover over each bar in the bar graph or
 on the line chart to check the print amount at the displayed time.
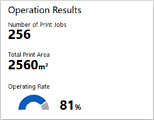
Displays the following:
-
Number of Print Jobs: Displays the number of print jobs sent from the printer.
-
Total Print Area: Displays the amount of paper for the print job in the unit you selected. Also, the item name display changes according to the specified unit. It is not displayed when Number of Jobs is selected as the unit.
-
Operating Rate/Throughput: Displays the operating rate for all monitored printers in a donut chart. Displays the throughput when imp. is selected as the unit.
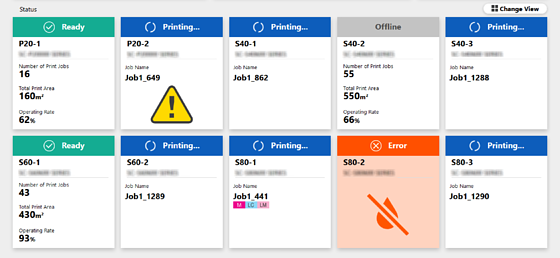
You can check a status summary for each monitored printer.
|
Item |
Description |
|
|---|---|---|
|
Change View |
Click to switch between different views in the following order:
|
|
|
Components |
Status |
|
|
Printer Name |
Displays the printer serial number or registered name. If you want to change the printer name, click |
|
|
Printer Information |
|
|